I’m finally getting around to sharing what, for me, is the most beautiful piece of physics we have yet stumbled upon. This is the physics of the critical point. It doesn’t involve enormous particle accelerators and it’s introduction can border on the mundane. Once the consequences of critical behaviour are understood it becomes truly awe inspiring. First, to get everyone on the same page, I must start with the mundane - please stick with it, there’s a really cool movie at the bottom…
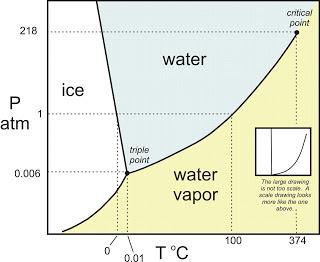
Most people are quite familiar with the standard types of phase transition. Water freezes to ice, boils to water vapour and so on. Taking the liquid to gas transition, if you switch on your kettle at atmospheric pressure then when the temperature passes 100 degrees centigrade all the liquid boils. If you did this again at a higher pressure then the boiling point would be at a higher temperature - and the gas produced at a higher density. If you keep pushing up the pressure the boiling point goes higher and higher and the difference in density between the gas and the liquid becomes smaller and smaller. At a certain point, the critical point, that difference goes to zero and for any higher pressure/temperature the distinction between the liquid and gas becomes meaningless, you can only call it a fluid.
The picture below, taken from here, shows the standard phase diagram, with the critical point marked, for water.
Magnets also have a critical point. Above the critical temperature all the little magnetic dipoles inside the material are pointing in different directions and the net magnetisation is zero. Below the critical temperature they can line up all the in the same direction and create a powerful magnet. While the details of this transition are different from the liquid-gas case, it turns out that close to the critical point the details do not matter. The physics of the magnet and the liquid (and many other systems I won’t mention) are identical. I’ll now try to demonstrate how that can be true.
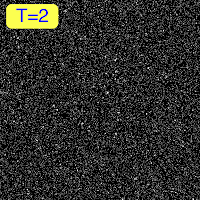
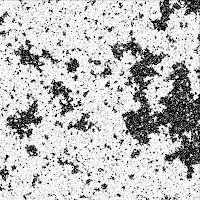
The pictures below are taken from a computer simulation of an Ising model. The Ising model is a simple model for a magnet. It’s been used for so much more than that since its invention but I don’t really want to get into it now. For the pictures below squares are coloured white or black. In the Ising model squares can change their shade at any time, white squares like to be next to white squares and black squares like to be next to black squares. Fighting against this is temperature, when there is a high temperature then squares are happier to be next to squares of a different colour. Above the critical temperature, if you could zoom out enough, the picture would just look grey (see T=3 below). Grey, in terms of a magnet, would be zero magnetisation.
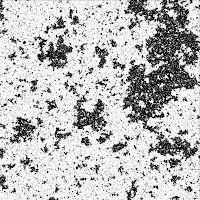
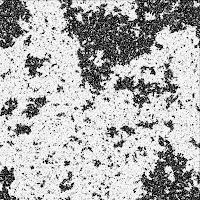
If you drop the temperature then gradually larger and larger regions start to become the same colour. At a certain point, the critical point, the size of these regions diverges. Any colder and the system will become mostly white, or mostly black (as above, T=2). Precisely at the critical point (T=2.69 in these units), however, a rather beautiful thing happens. As the size of the cooperative regions diverge, so too do fluctuations. In fact at the critical point there is no sense of a length scale. If you are struggling to understand what this means then look at the four pictures below. They are snapshots of the Ising model, around the critical point, at four very different scales - see if you can guess which one is which.
Now watch this movie for the answer (recommend switching to HD and going full screen).
The full picture has 2^34 sites (little squares), that’s about 17 billion. This kind of scale invariance is a bit like the fractals you get in mathematics (Mandelbrot set etc) except that this is not deterministic, it is a statistical distribution.
How does it demonstrate that the details of our system (particles, magnetic spins, voting intentions - whatever) are not important? In all these cases the interactions are short ranged and the symmetry and dimension are the same. Now imagine that you have a picture of your system (like above) at the critical point and you just keep zooming out. After a while you’ll be so far away that you can’t tell if it’s particles or zebras interacting at the bottom as that level of detail has been coarse grained out and all the pictures look the same. This is not a rigorous proof, I just want to convey that it’s sensible.
Of course the details will come into play at some point, the exact transition temperature is system dependent for example, but the important physics is identical. This is what’s known as universality, and it’s discovery, in my opinion, is one of the landmarks in modern physics. It means I can take information from a magnet and make sensible comments about a neural network or a complex colloidal liquid. It means that simple models like the Ising model can make exact predictions for real materials.
So there it is. If you don’t get it then leave a comment. If you’re a physics lecturer and you want to use any of these pictures then feel free. I’d only ask that you let me know as, well, I’d like to know if people think it’s useful for teaching. For now you’d have to leave a comment as I haven’t sorted out a spam-free email address.
UPDATE: Forward link to a post on universality.
